.svg)
The primary objective of data-driven decision-making is to ensure organizations gather relevant data to back up their critical decisions, rather than indiscriminately measuring everything and ultimately being overwhelmed by data, yet starved for insights.
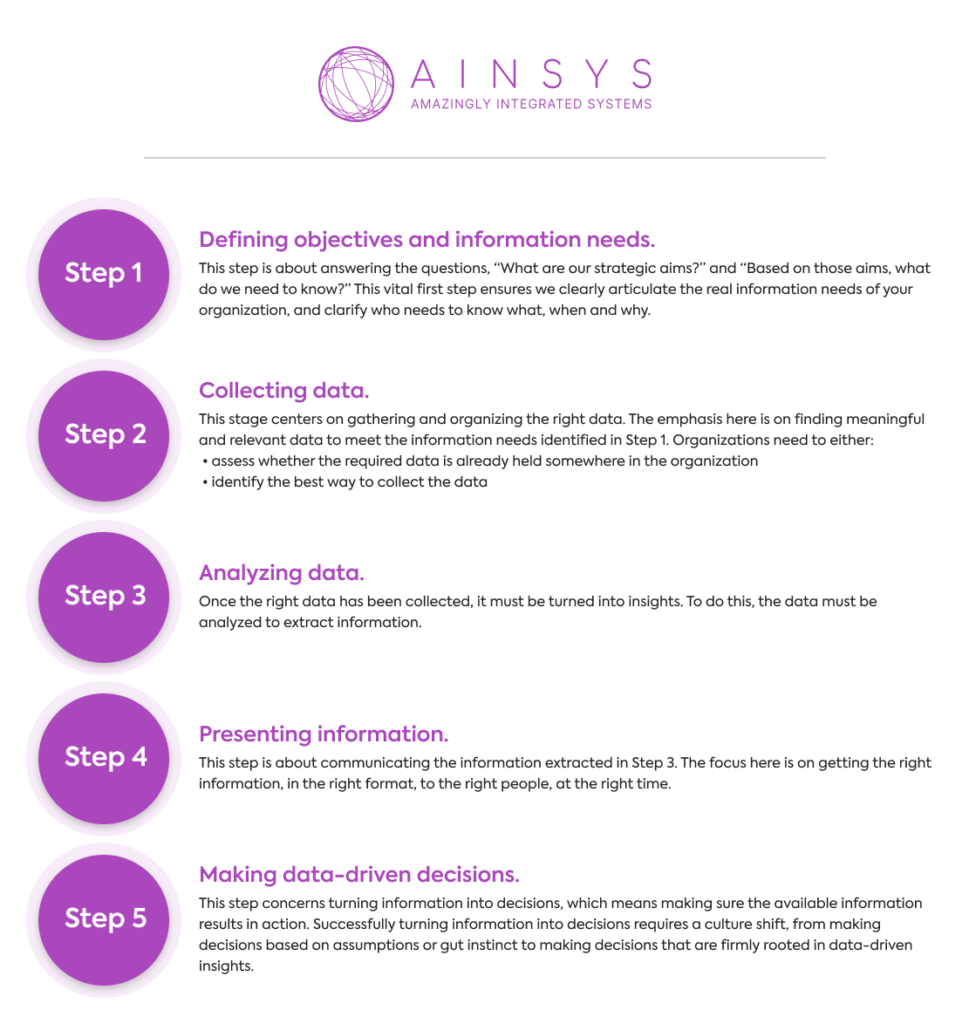
Today, we’ll explore practical instances of organizations implementing data-driven decision-making, as detailed in CPA Canada’s Guideline titled “From Data to Decisions: Five Steps to Data-Driven Decision Making” and present a comprehensive outline of the five-step procedural framework for executing data-driven decision-making.
Google’s mission statement is to organize the world’s information and make it universally accessible and useful. In the pursuit of this mission, the company places a high emphasis on using information to inform their decisions.
Established by two engineers, Google is a company where data-driven insights are ingrained in its DNA. Googlers, as Google employees are known, are fluent in the language of data, which is a fundamental part of their corporate culture. In fact, Google strives to base all decisions on data and analytics.
Data can provide invaluable answers, but only if the questions that need to be answered are clear. Google’s approach is to start with these questions and to have a clear understanding of the information it needs from the outset. As Eric Schmidt, the company’s former executive chairman, has stated, “We run the company by questions, not by answers.”
Within its global HR function, Google has established a people analytics department that enables the organization to make data-driven people decisions. One question that Google sought to answer was, “Do managers actually matter?” This is a question that had been a topic of debate within the company for years. At one point, Google even eliminated all managerial positions, making everyone an individual contributor. This approach proved unsuccessful, and managers were reinstated, but the question of their importance remained.
Thus, Google identified a critical people-related question that it wanted to answer: Do managers matter?
Initially, the people analytics team examined the existing data sources: performance reviews (manager evaluations from above) and employee surveys (manager evaluations from below). The team plotted this data on a graph, which indicated that managers were generally perceived positively. However, the data did not show much variation, leading the team to divide the data into the top and bottom quartiles.
Through regression analysis, the team was able to demonstrate a significant difference between these two groups in terms of team productivity, employee happiness, and employee turnover. In essence, teams with better managers performed better, and their employees were happier and more likely to stay.
This answered the original question – managers indeed mattered – but it did not provide much in terms of actionable insights. Therefore, the team formulated a new question: “What makes a good manager at Google?”
To answer this new question, the team introduced two new data collection methods. The first was a “Great Managers Award,” where employees could nominate managers they felt were particularly effective. As part of the nomination, employees had to provide examples of behaviors that justified their positive assessment of managers. The second data set came from interviews with the managers in each of the two quartiles (bottom and top) to understand their actions or inactions (the managers were not aware of which quartile they were in).
Data from the manager interviews and the Great Manager Award nominations was coded using text analysis to extract the top eight behaviors of a high-scoring manager, as well as the top three reasons why managers were struggling in their role.
According to the findings, a high-scoring manager exhibited the following eight characteristics:
Moreover, the data revealed that the top three factors causing a manager to struggle were:
Google employed various methods to share these insights with the relevant managers. The top-level team received a newspaper-style report with headlines, graphs, and narratives. Senior and middle managers received a more action-oriented analysis, outlining the findings and expectations for them as managers.
Merely sharing insights with managers was not sufficient; Google needed to implement actions based on what the data revealed. Several concrete actions followed this analysis, but some of the key ones include:
Google initiated the measurement of people against these behaviors and introduced a new bi-annual feedback survey to assist with this measurement. The company decided to continue with the Great Manager Award to further assess manager performance. Google also revised its management training to support and promote the most desirable management behaviors.
Beyond Google, the ability to identify and screen for desirable behaviors is becoming more common in recruitment. In essence, when you understand what constitutes a good manager (or a good customer service advisor, or a good salesperson), you can hire individuals who fit that profile – based on solid data rather than gut instinct. This screening process is becoming increasingly automated, thanks to AI-driven recruitment tools.
In fact, Google offers its own recruitment tool in the form of a recruiting app called Hire. The app has numerous features, such as the ability to schedule interviews and communicate with candidates more easily. However, one of the most exciting features is the ability to analyze resumes. Hire analyzes resumes and screens them for key terms relevant to the job description and person specification. This enables HR teams to screen applicants more quickly and find the best person for the job.
Turning to another key strategic priority for Google, the company has been fully carbon neutral since 2007, but it continues to seek new ways to reduce the energy consumption of its network of data centers. Given that data centers account for 2% of the world’s global energy usage, primarily due to the vast amount of energy used to cool data centers, this is a significant priority for Google.
The challenge lies in the complex nature of data center cooling equipment. There are billions of possible configurations of servers, chillers, cooling towers, heat exchangers, and control systems, and determining which configuration will lead to optimal energy efficiency is a task far beyond human capabilities.
So, to answer the question, “How can we reduce the amount of energy used to cool our data centers?” Google turned to machine learning algorithms. These algorithms can identify patterns across various systems, understand how they impact the cooling infrastructure, and make decisions on the best configuration of equipment. A recent Google pilot indicates that machine learning has helped to deliver a 40% reduction in the overall amount of energy used to cool a data center.
Service Hotel is a boutique hotel chain, family-owned, that emphasizes personalized service within the mid-tier market. The hotel was gathering conventional performance metrics such as:
The majority of this data was internal to the company, with minimal utilization of external data. Moreover, despite regular reporting of this data, it seldom informed decision-making. The objective was to foster a culture of data-driven decision-making throughout the organization.
Initially, the leadership team revisited their strategic plan and established a set of high-level questions that required resolution. This process provided a structured approach for data collection and analysis, ensuring that the data gathered was directly associated with their key informational needs and unresolved queries.
They pinpointed approximately 15 strategic objectives. Across these, they formulated 22 critical questions, including:
The organization systematically addressed these questions, evaluating the effectiveness of the existing data in providing answers to their key inquiries. In many instances, this necessitated the introduction of new data collection methodologies or the augmentation of existing internal data sets with external data.
For instance, in the context of predicting occupancy rates and optimizing pricing, the hotel was primarily relying on its own historical occupancy and pricing data. This was expanded to incorporate external data such as meteorological reports, local event schedules, and competitor pricing information. Such data is routinely utilized in the hospitality industry to generate a more precise demand forecast throughout the year and to ascertain a fair valuation for rooms.
In terms of assessing customer and employee satisfaction, the organization had ample data from their respective satisfaction surveys to discern whether happier employees deliver superior service. However, the team recognized that data collection could be streamlined and conducted more frequently. The annual survey was not providing the depth of data they required and only permitted annual analysis. Consequently, they introduced a more concise and frequent online employee satisfaction survey. As the data was now sampled (e.g., 1/12 per month), the resources required for data collection and analysis did not significantly increase. The company also ensured that data collection was in compliance with data privacy laws and legal stipulations.
A similar approach was adopted for customer satisfaction and loyalty, but in this case, entirely new data collection methods were introduced. Instead of the lengthy and costly annual customer satisfaction survey, they transitioned to two simpler indicators: the Net Promoter Score (NPS) and online ratings from review sites. NPS is a metric based on a single question: “How likely are you to recommend us to a friend?” and is rated on a 10-point scale. This indicator is now collected in monthly customer surveys that sample a portion of recent guests. The second indicator is online customer reviews and ratings, such as TripAdvisor scores. This data is not only freely available but also highly public, meaning potential customers utilize this information to inform their booking decisions.
To ensure thorough data analysis, the team onboarded a new analyst and provided training to two existing employees, one from the finance department and the other from HR. The data on employee satisfaction and customer satisfaction were subjected to correlation analysis to assess the strength of the relationship. The NPS data was also cross-examined against customer and finance data to identify any connections.
The organization unearthed strong correlations between customer satisfaction and organizational performance. A correlation was also found between employee satisfaction and service delivery, suggesting that happier employees tend to provide superior customer service.
For an in-depth analysis of online customer feedback, the team employed sentiment analysis and natural language processing tools to sift through online customer reviews and extract actionable insights. This was correlated with internal finance data, which indicated that positive online reviews led to immediate sales increases.
The team also utilized customer lifetime value analytics to identify the customers most valuable to the business. This is a crucial metric for hotels, as not all guests contribute equally to revenue. Some guests may spend significantly on dining, spa treatments, and other services, while others may have minimal interaction beyond checking in and out. Identifying customers likely to spend more over the duration of their relationship with the hotel allows the organization to customize their sales and marketing strategies accordingly.
In terms of predicting occupancy and optimizing pricing, the team employed a machine learning algorithm to analyze extensive internal and external data to identify patterns. This not only provides a more detailed insight into the hotel’s occupancy patterns but also allows the system to dynamically adjust pricing, similar to the models used by Airbnb and Uber.
The organization recognized that the existing management reports were not furnishing the necessary information. Previously, the key performance indicators (KPIs) were presented biannually in data tables, demonstrating performance against targets and comparing performance to the previous year. This format made it challenging to derive insights, correlate different data sets, and identify trends and performance patterns over time.
In response, the organization introduced a set of dashboards, with a one-page summary dashboard for each of the 22 key analytics questions, updated on a monthly basis. These new dashboards adhered to the principles of a newspaper front page, featuring a headline, a visual, and a high-level narrative. Each summary dashboard now includes:
The management team now reviews the data regularly at weekly operational and monthly strategic meetings. Each meeting examines five questions on a rotating schedule, with a portion of time allocated to exceptional issues. The management team ensures that any data not used for decision-making is either discontinued or replaced with more useful analysis. Decisions made so far include:
Artificial intelligence is revolutionizing the manner in which hotels engage with their guests. A prime example of this is Connie, Hilton’s new AI-powered robot concierge. Functioning akin to a human concierge, Connie leverages natural language processing to comprehend and respond to guests’ inquiries in real-time.
The hospitality industry is witnessing the deployment of numerous other AI-enabled customer service solutions. Chatbots or AI-based virtual assistants are increasingly being utilized to augment guest satisfaction. They handle simple questions and requests through direct messaging, eliminating the need for guests to call the front desk for services such as late-night food orders. Guests can simply interact with the hotel’s chatbot service on their mobile devices.
These technological tools equip hotels with the capability to gather data from every customer interaction. They offer instant and consistent response times, which significantly enhances customer service as chatbots do not experience fatigue even during night shifts. This allows the hotel staff to use their time more efficiently. Moreover, the hotel gains access to a wealth of valuable data about its customers’ preferences and requirements.
Walmart, one of the world’s largest retailers, has been in operation for decades, yet it continues to compete with Silicon Valley tech companies in terms of data utilization and innovation. In fact, Walmart leverages data to enhance the efficiency of its retail operations and improve the shopping experience for its customers. Here, we explore a few ways in which the retail behemoth effectively uses data to inform decision-making.
One area where Walmart has achieved notable success is in the democratization of data. The company provides employees at all levels with the data they need to make more informed decisions, improve sales and customer service, and identify opportunities to enhance performance.
Walmart has established what it refers to as the Data Café, a state-of-the-art, centralized analytics hub. Here, Walmart’s personnel can pose critical business questions and obtain the answers they need. The underlying concept of the Data Café is straightforward: the quicker Walmart’s personnel can access data and unlock insights, the faster they can make decisions and take appropriate action.
While the democratization of data is theoretically a commendable idea, it needs to be implemented in a controlled, thoughtful manner to prevent employees from being overwhelmed by information. Consequently, at Walmart, analytics experts collaborate closely with retail staff to delve into the company’s vast data sets and extract the insights those employees need. This approach is essentially Walmart’s method of assisting people in identifying their key analytics questions. Anyone can enter the Data Café, consult with a data scientist, and determine the precise question to which they need an answer.
The Data Café draws data from hundreds of sources, both internal and external to the company. Internal data includes 200 billion rows of transactional data, which astonishingly represents just a few weeks’ worth of transactions. External data encompasses weather data, social media data, gas prices, economic data, and local events databases. In Walmart’s perspective, any piece of information within this vast array of data could potentially answer critical questions and resolve business challenges.
Indeed, the sheer volume of data that Walmart routinely collects means the company is effectively constructing the world’s largest private cloud, capable of processing 2.5 petabytes per hour. (For context, the total content in academic research libraries across the entire USA amounts to an estimated 2 petabytes.)
Moreover, Walmart is exploring innovative methods of collecting relevant data, going beyond typical transactional data. For instance, the company has experimented with using facial recognition data to combat shoplifting and is contemplating expanding this to determine whether shoppers in-store are happy or frustrated when waiting in line. When high levels of frustration are detected, the system could alert managers to open more checkouts.
Walmart has also filed a patent to introduce tags into products capable of gathering data on customer usage, monitoring expiration dates, and even automatically ordering replacement products when needed. In theory, Walmart could anticipate when you are about to run out of washing powder and automatically add it to your shopping list. This technology would provide Walmart with incredible amounts of data on customer behavior, including when and how often they use Walmart’s products.
At the Data Café, Walmart’s more than 200 streams of internal and external data can be modeled, manipulated, and visualized in a matter of seconds to generate real-time solutions to business questions. Consequently, the time it takes to find answers and solve business questions has been reduced from weeks to minutes. This ability to analyze data and extract insights so quickly offers a significant competitive advantage for the company.
Walmart has successfully bridged the gap between frontline retail employees and analytics experts to find the answers they need. Instead of circulating lengthy reports or expecting employees to navigate through data in complex self-service dashboards, teams from across the company are invited to bring their problems to the Data Café’s analytics experts. Here, they can be presented with a solution, visualized on touch screen “smart boards,” within minutes.
In addition to responding to questions and problems, the analytics hub can also deliver automated alerts when specific metrics fall below certain thresholds. For instance, during Halloween, analysts noticed in real time that a novelty cookie, which had been selling well in most stores, was not selling at all in one store. The store was alerted and, after a quick investigation, it was discovered that a simple stocking oversight had led to the cookies not being displayed on the shelves. The store’s staff were able to rectify this immediately.
Whether it’s through teams bringing questions to the Data Café, or the system automatically flagging when something doesn’t look right, this rapid access to data has enabled individuals at all levels of the company to make better decisions, improve sales, and enhance performance. In essence, thanks to the Data Café, data leads to action.
For example, one of Walmart’s grocery teams approached the Data Café for assistance in determining why sales had suddenly declined in one particular product category. By delving into the data, the analytics and grocery teams were quickly able to identify that a simple pricing miscalculation had resulted in products in that category being listed at a higher price than they should have been. The miscalculation was corrected, and sales for this particular category returned to normal.
Undoubtedly, Walmart has extraordinary volumes of data to work with, far more than the average company. However, one lesson that any organization can learn from Walmart is the importance of being able to react to data quickly and make decisions based on what the data reveals.
In today’s competitive and unpredictable business landscape, an organization’s ability to learn and act faster than its competitors is a key determinant of success. The framework outlined in this guideline is specifically designed to enable organizations to achieve this.
The strategies and tools presented as part of the five-part model aim to empower organizations to become more data-driven in their decision-making processes, thereby avoiding the pitfalls of relying solely on gut instinct or potentially misleading half-truths.
We stand on the brink of a transformative era in business. With more data available than ever before and the continuous development of innovative methods to extract unprecedented insights from this data, businesses of all sizes and across various industries are empowered to make superior decisions, enhance performance, and strengthen their competitive position. By aligning data with strategy, collecting the most relevant data, analyzing this data to extract valuable insights, and communicating the information in a manner that enables action, any organization can achieve superior results.
The influence of data is so profound that, within a few years, the term “data-driven decision-making” may become redundant: data will be at the heart of all business decisions and its use will become instinctive. Organizations that can stay ahead of the curve and implement this five-step framework for improved decision-making will secure an even greater competitive advantage in a data-driven world.
To get ahead, you will also need the right data tools for collecting, analyzing, and presenting data within days and hours instead of weeks and even months. To achieve these goals, build a data architecture, or scale your business, you will need AINSYS integration framework that syncs data between every tool and platform your IT team employs. By implementing AINSYS tools, any data specialist can ensure they make the right decisions for your organization and keep up with the ever-changing technology landscape.


